Comprehension
questions for above image:
1. What
is the main purpose of the information on this chart?
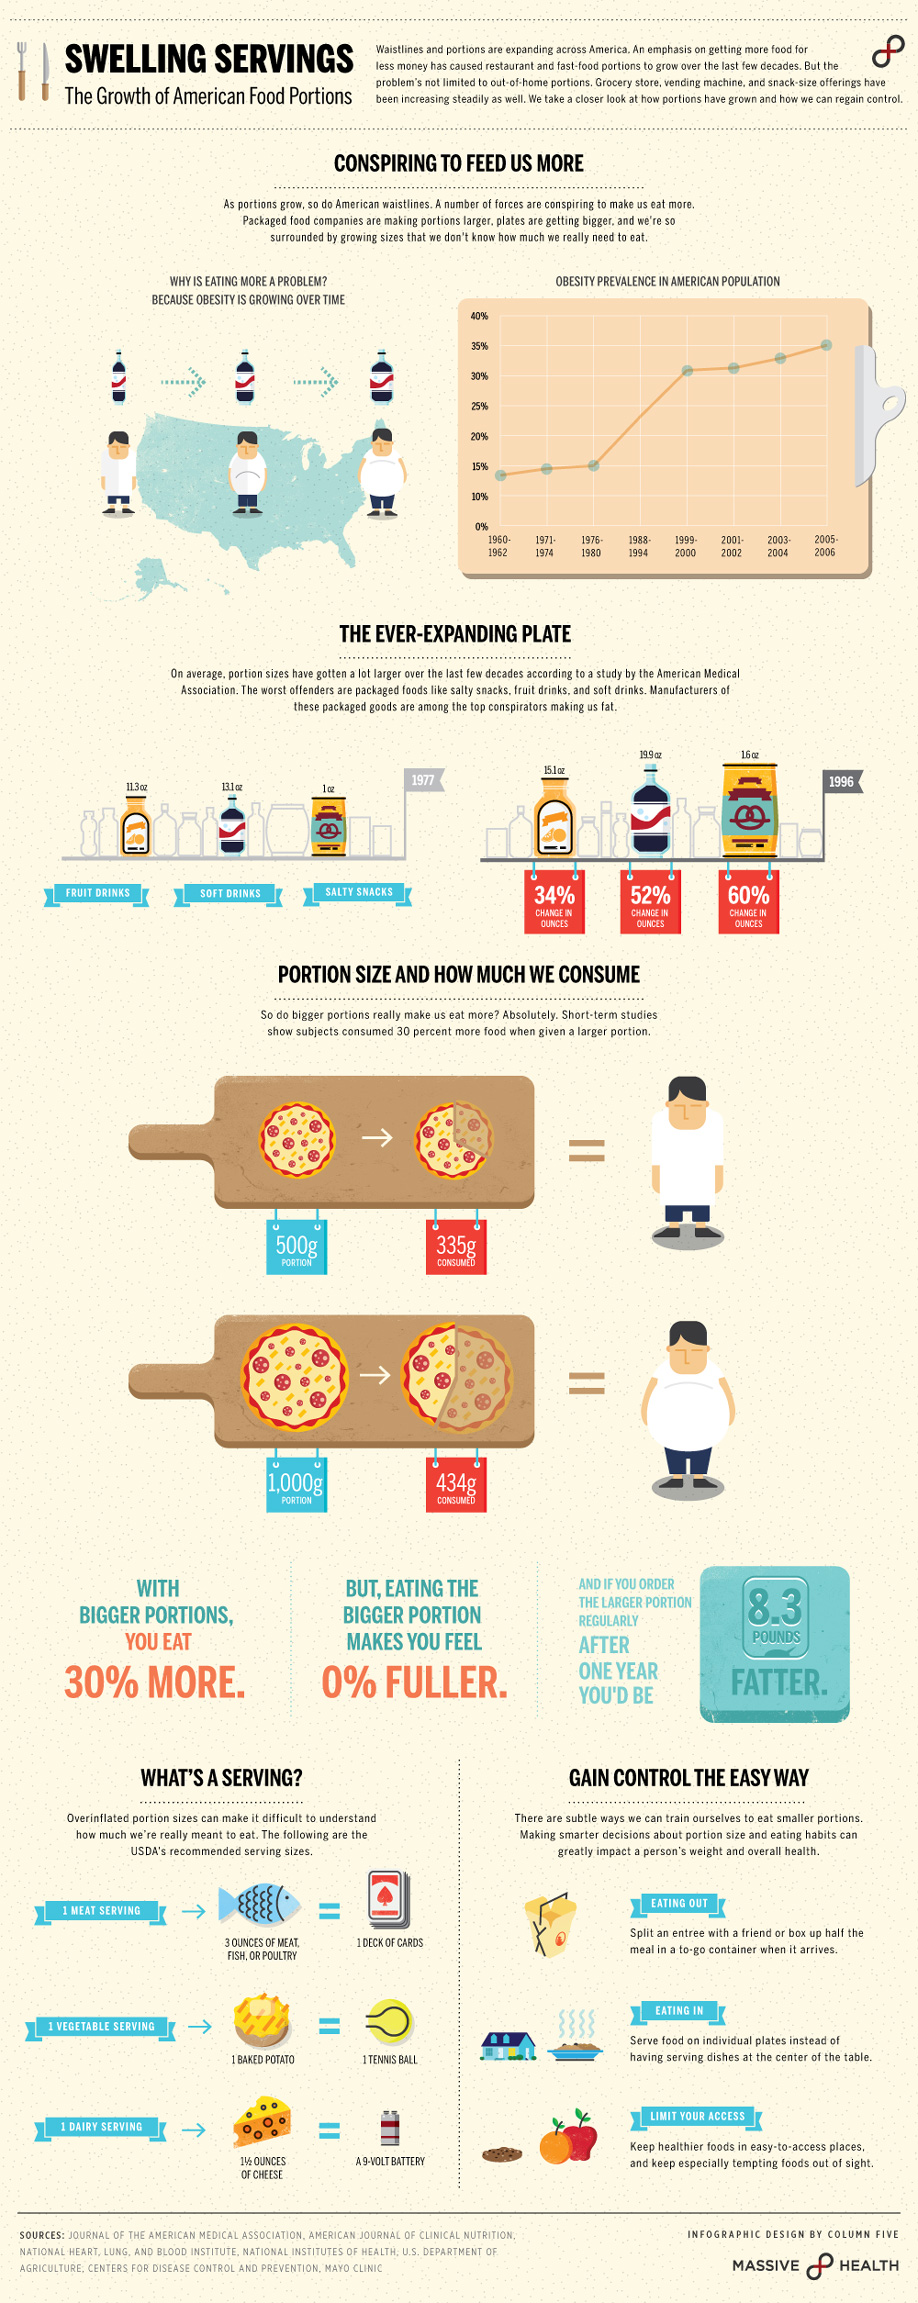
a. to
show the growth of portion sizes over the years
b. to
show only obesity growth
c. to
persuade people to change product sizes
d. to
persuade people to eat more
2. According to the graph on the poster, how much
has the obesity rate gone up over 40 years?
a. 10%
b. almost
20%
c. almost
40%
d. 5%
3. Since 1977, how much have sizes gone up for
salty snacks?
a. 15
oz.
b. 12
oz
c. 6 oz
d. 4 oz
4. According to the information on the poster,
what is a conclusion you can make based on bigger portion sizes?
a. you
always feel fuller after you eat bigger
portions
b. you
usually eat the same amount even with a larger portion
c. you
usually eat thirty percent more with a bigger portion
d. you
will not gain weight from always eating bigger portions
5. According to the information on the poster, a
serving size of meat is about the same size as what object?
a. a
battery
b. a
tennis ball
c. a
deck of cards
d. a
light bulb
1.
What is the main purpose of the information on this chart?
a. to show the growth of portion sizes over the years
b.
to show only obesity growth
c.
to persuade people to change product sizes
d.
to persuade people to eat more
2.
According to the
graph on the poster, how much has the obesity rate gone up over 40 years?
a.
10%
b. almost 20%
c.
almost 40%
d.
5%
3.
Since 1977, how much
have sizes gone up for salty snacks?
a. 15 oz.
b.
12 oz
c.
6 oz
d.
4 oz
4.
According to the information
on the poster, what is a conclusion you can make based on bigger portion sizes?
a.
you always feel
fuller after you eat bigger portions
b.
you usually eat the same amount even with a larger portion
c. you usually eat thirty percent more with a bigger portion
d.
you will not gain weight from always eating bigger portions
5.
According to the
information on the poster, a serving size of meat is about the same size as
what object?
a.
a battery
b.
a tennis ball
c. a deck of cards
d.
a light bulb